Introductions
Hi everyone! As you're coming in please fill out the attendance trackers. I'm also going to ask you to sit next to someone that's in a different lab than you.
(After everyone's here) Let's go around and do some introductions. Just say your name, your lab/department, and your favorite organism.
Overview of the workshop
What is project management and why are we doing this?
Welcome to the first day of our "Healthy Habits for Data Science" workshop! We're doing this workshop because we've realized that there are a lot of headaches that can be avoided by understanding and implementing some specific pratices in your bioinformatics project, and really any data project in general. The concepts and skills you'll learn in this course will help you track your project history, collaborate with others, publish more, and fulfill requirements. The course is structured around a paper that we'll be reproducing in part. We'll use that activity to introduce the concepts we think are the most important for when you do your own project. You don't have to know anything about the biological background of the paper or have familiarity with the specific analysis they used as we'll provide the scripts and the data.
Today we'll be looking at the paper and its associated GitHub repository and discussing the concepts of project management, FAIR data, data management, and reproducibility. For hands on work, we'll set up a project directory on the cluster and learn how to transfer files between the cluster and your personal computer.
Open science
A lot of this workshop would not be possible without the concept of open science and many of the healthy habits are also part of the open science movement. Open Science encompasses a lot of topics, but for this workshop the most relevant is open data and open source. And for us teachers, we're also interested in open educational resources, because as the informatics group, we generate workshop materials that are available to the public and we want to connect students with other resources that are also freely available.
Why should we care open science?
- Makes science easier for everybody at every stage
- Gives your science more reach and impact
- Increasingly required by funders and governments
Note, that it's not just about publishing your journal article in an open access journal. Your research products encompass preprints, conference presentations, posters, data, figures, code, and protocols.
FAIR principles
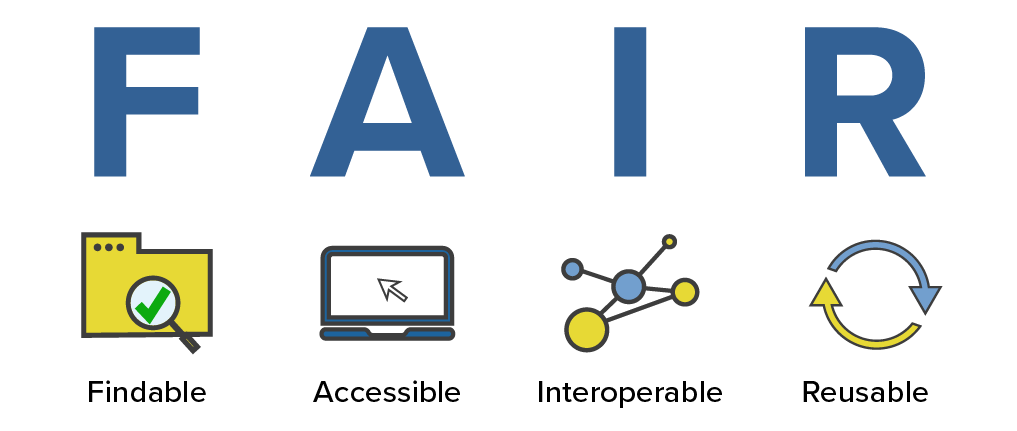
Related to open sciences are the FAIR principles. The FAIR principles are a set of guidelines that are meant to make data more findable, accessible, interoperable, and reusable. The principles are not specific to bioinformatics, but they are particularly relevant to bioinformatics because we often work with large datasets and data that is potentially generated by someone else.
This is how the NIH National Library of Medicine breaks down the FAIR principles:
- Findable: For data to be findable there must be sufficient metadata (metadata is data about data); there must be a unique and persistent identifier; and the data must be registered or indexed in a searchable resource.
- Accessible: To be accessible, metadata and data should be readable by humans and by machines, and it must reside in a trusted repository.
- Interoperable: Data must share a common structure, and metadata must use recognized, formal terminologies for description.
- Reusable: Data and collections must have clear usage licenses and clear provenance, and meet relevant community standards for the domain.
What does interoperability mean?
- Interoperability of file formats
- Avoid using proprietary file formats like excel, word, quicktime, and others
- Use open file formats like .csv, .tsv, .md, .txt, .tiff, pdf, .mp4, etc.
- If unavoidable, convert proprietary file formats to open file formats, or document the software needed to use the file format
The data management life cycle
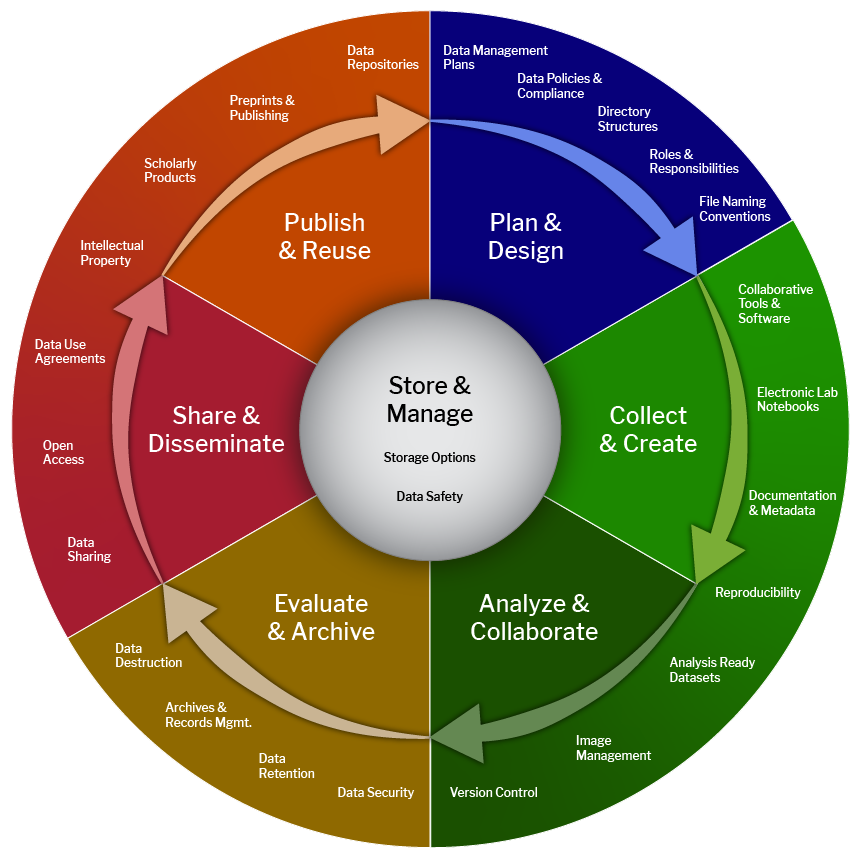
- Planning for how you're going to store data throughout the life cycle
- Life cycle:
- https://datamanagement.hms.harvard.edu/
- https://hlrdm.library.harvard.edu/
- Continuum of activties, not "one and done"
- No one entity is responsible for managing data, so you need input from
- Library: Harvard library research data services, archives
- IT/Research Computing
- Research Admin (compliance w/ University policies)
- PI/grant manager
- Core facilities
- Emphasize onboarding early in career or project
- Review data management plan for the project you're on
- dmptool.org
- Offboarding of data is also important!
3 2 1 plan 3 Copies, 2 Formats, 1 Offsite
Don't be part of the problem (problem examples)
- Research methods dead end
- Poorly documented hand-me-down data
- Loss of data due to hardware failure/natural disaster
- Data not available for reanalysis
- Excel converion problems (e.g. gene names and UK COVID tracing data using XLS)
If you want to learn more about the general principles of data management, the Harvard Library has an excellent youtube playlist covering many aspects of data management, open science, etc. They also hold office hours and do consulting
DISCUSSION: Have you ever heard of or seen your lab's data management plan? What are some things it covers?
Open science in practice
Keeping all these in mind, let's take a look at how open science is reflected in an actual journal article.
ACTIVITY: Browse the paper and its github repo and look at different aspects of how open sience is reflected. What do you see? What more do you wish to see?
Here are some things I see * The paper is open access * There is a doi for the paper (digital object identifier) * The paper has a creative commons license * The version history and reviewer comments and author responses are available * Authors have ORCID ids * The paper has a github repository with all code use to generate the data AND the github repo is backed up to Software Heritage! * The sequencing data is in an NCBI repository that is relevant to their field * The methods has a link/recipe ... but it's a 404 (link decay) * Link to request protocol
Here's what I see in the github repo * Detailed README * Version numbers for software needed * Exact directions to reproduce everything * Rmarkdown files for all analysis as well as knitted html versions
I'm now going to demonstrate how I went about finding the data files for the paper.
Go to the github page for the paper and find the link to the data, then click "SRA Run selector" and select all 4 items that are of Assay Type "RNA-Seq". Then, download the "Accession List". This is a list of the SRA accessions, which correspond to individual fastq files. Unfortunately, the metadata is not included, and you have to refer to the github repo, which lists the GEO accession but not the SRA accession. Then you need to manually rename the files to their sample names. So the process you have to go through to get the data files in the way they want you to have them is a bit convoluted.
DISCUSSION: How does this compare to the FAIR principles? How would you improve upon this?
FAIR principles apply to both the data and the metadata, so I would say that the data is findable, but lacks in the accessibility department. And, if we look at the copyright license on the paper, it's distributed under a CC-BY license, which is a very open license. So the data is reusable. It's interoperable because it's in a standard and non-proprietory file format.
Overview of paper
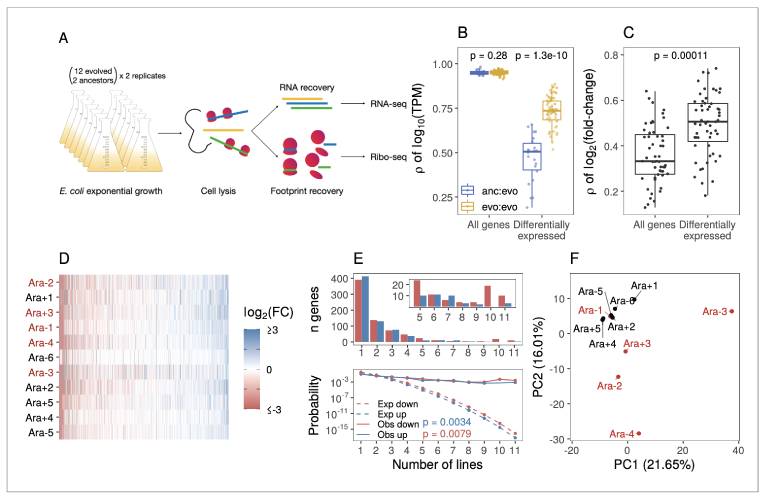
The paper we're reproducing is "The landscape of transcriptional and translational changes over 22 years of bacterial adaptation" by Favate et al. (2022). The basic premise is that 12 lines of E. coli have been evolving in the lab for 22 years and the authors are interested in finding out whether transcriptional changes have happened over that time period compared to the ancestor strain. Transcription is the creation of mRNA from DNA, so the genetic changes of these lines are well characterized but the authors are curious of the actual expression of these genes are different.
All these lines have been frozen in glycerol stock so that they can preserve the exact genetic makeup of each time point in this long term evolution experiment and resuscitate the cells at any time. The authors revive the lines and sequence their RNA to assess transcriptional activity. They also did something called ribo-seq to assess translation, but we're not going to be analyzing that data. We'll be recreating a few panels from figure one of the paper.
But we're not that interested in interpreting the results. We're interested in the process of generating the results and how to do it reproducibly and with less headache.
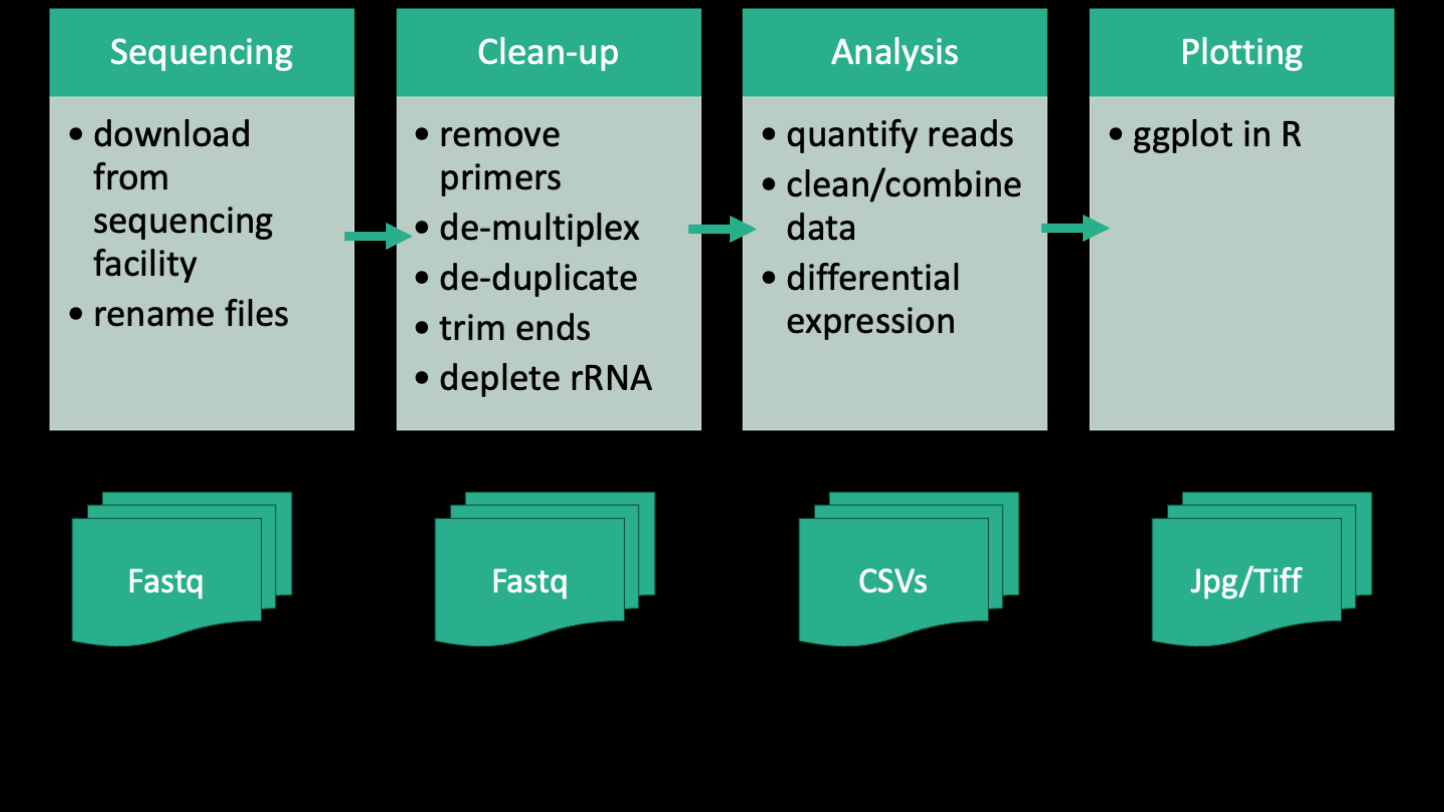
Here's a simplified outline of the bioinformatic workflow that the authors took for the analysis of the RNA-seq portion of their paper. The workflow can be split into four parts, which are summarized as Sequencing, Clean-up, Analysis, and Plotting. Below each of those steps is shown the files that are generated at each part. The sequencing part kind of straddles the line between bench work and computer work. How you design your sequencing project will inevitably affect how you process the data downstream. So decisions like whether to include standards, how many replicates, how you prepare you library, etc will all come home to roost in the bioinformatics. If you have a sequencing project in mind and want help planning it, the Bauer Core (which is the sequencing core facility at FAS) can consult with you for free. And you can also have one of us (the informatics group) sit in on those meetings to help you anticipate the bioinformatics needs. In the case of the paper, the authors generated short single-end reads of the cDNA of each E coli evolved line and the ancestor using the Illumina platform. The raw data is in the form of 4 fastq files between 5 and 12 GB in size.
The next part of the workflow is the clean-up. The clean up that data need is very specific to a project, but for sequencing data generally involves some sort of quality control and standardization. In this case, the authors needed to remove the primers, demultiplex the reads, remove duplicate reads, trim the ends, quality filter each read, and then remove unwanted reads belonging to rRNA. rRNA (ribosomal RNA) is the most abundant RNA in a cell and it's not usually of interest in a transcriptomics experiment because it's part of the translation machinery rather than the actual expression of genes. The products of this step are more fastq files, including lots of intermediate files. Eventually we end up with 31 fastq files that correspond to the individual samples. Due to the size and number of files, it is often expedient to perform clean-up on an HPC (high performance computing) cluster. We'll be doing at least one of the first steps of the clean-up on day 2 to show you how that works.
The third part of the workflow is analysis, which is comprised of quantifying reads using a software called kallisto and then doing differential expression analysis using an R package called DESeq2. Kallisto is a software that is generally run on an HPC cluster because it can be computationally intensive, while DESeq2 is run locally on a personal computer. The products of this step are a few tables in the form of .csv files. Analysis can be the most sprawling part of the workflow, and it can combine a multiple types of scripts and coding languages. It's usually this stage that is the most difficult to keep in mind good practices, because you might be trying exploratory things and going back and forth between different data sets in a non-linear way. But it's equally important to keep on top of your organization at this point because it's super easy to get lost and not be able to reproduce your results.
The final part of the workflow is plotting. This is the part where you take the tables and make them into figures. This is usually done in R or python, and the products are figures in the form of image files.
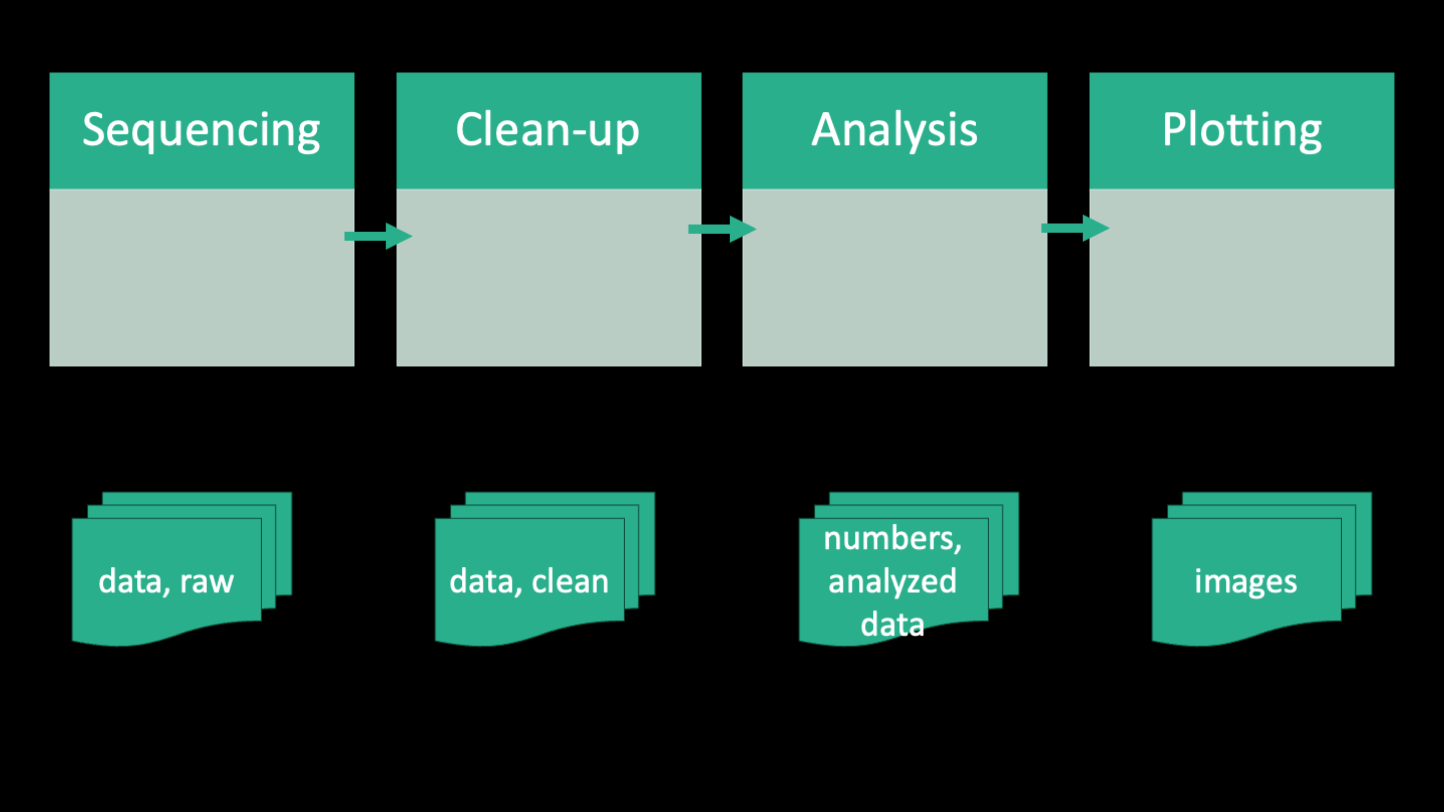
Zooming out, if you ignore the texts in this workflow, this image illustrates that bioinformatics fundamentally is about transforming raw data to processed data to summary tables, and then finally figures using code.
We'll be coming back to this workflow in a minute, but first, let's talk about what kinds of analysis you all do and what might a computational workflow look like for you. Let's get a couple of volunteers to draw a computational workflow they are familiar with. If you're still in the data gathering stage or earlier, maybe draw something that you've heard others in your lab doing.
ACTIVITY: ask students to get up and draw an example workflow from their lab
Project management
Project directory and file organization
The reason we talk about workflow first is because it feeds directly into the organization of the project. The healthy habit that inspired the idea of this workshop is the idea of a project directory. On computers, files are organized into folders or directories and this is both for the user's benefit as well as for the computer to know where things are. The minimum amount of organizing one can do is put all the files related to a project into a single directory.
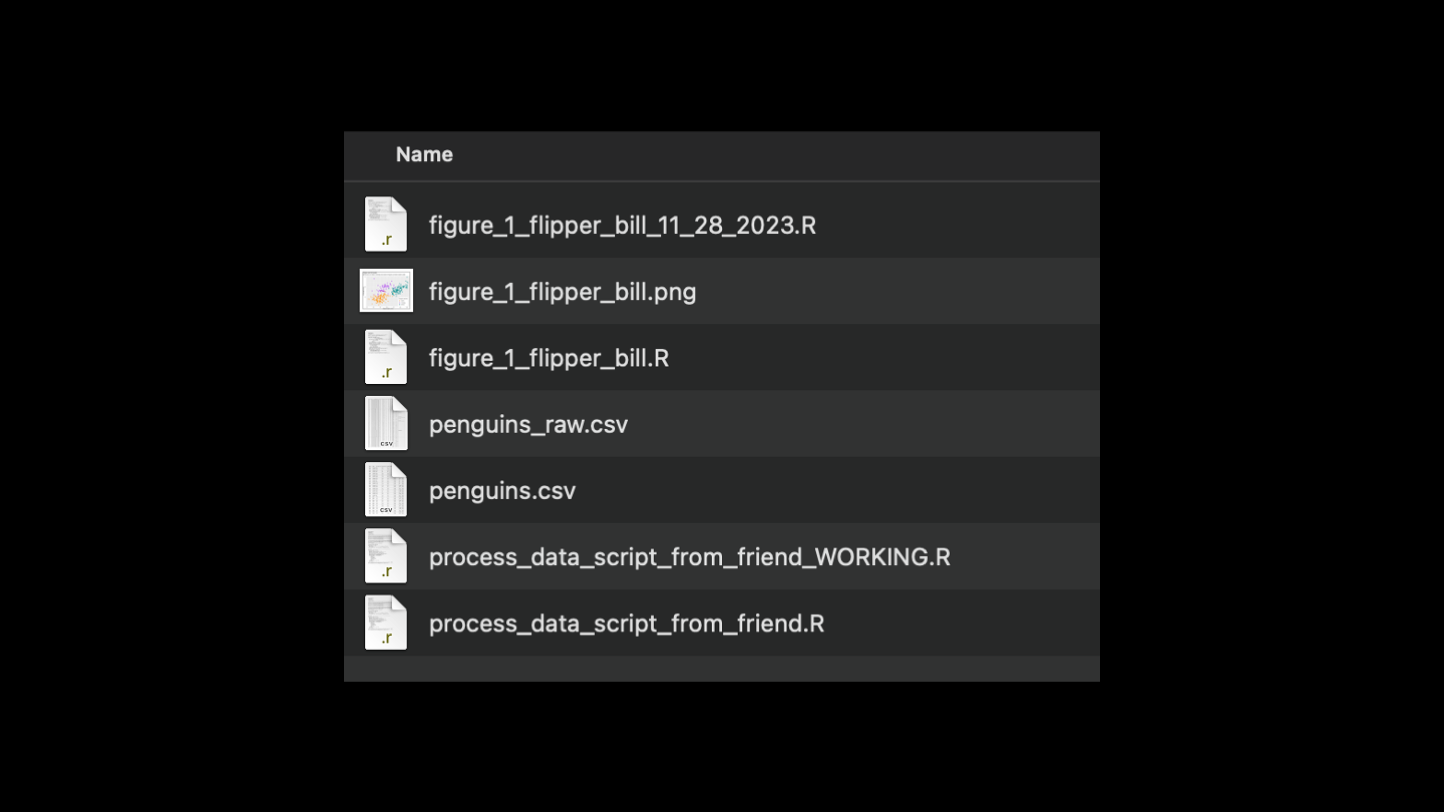
This is a common organizational method. There's 1 folder with all figures, scripts, and data. Perhaps you rely on renaming files to keep track of different versions of scripts or different versions of data. It's unclear how each figure is generated, or with what script. This is a lot of cognitive overhead that must be overcome every time you start doing your work on this project! How can it be better?
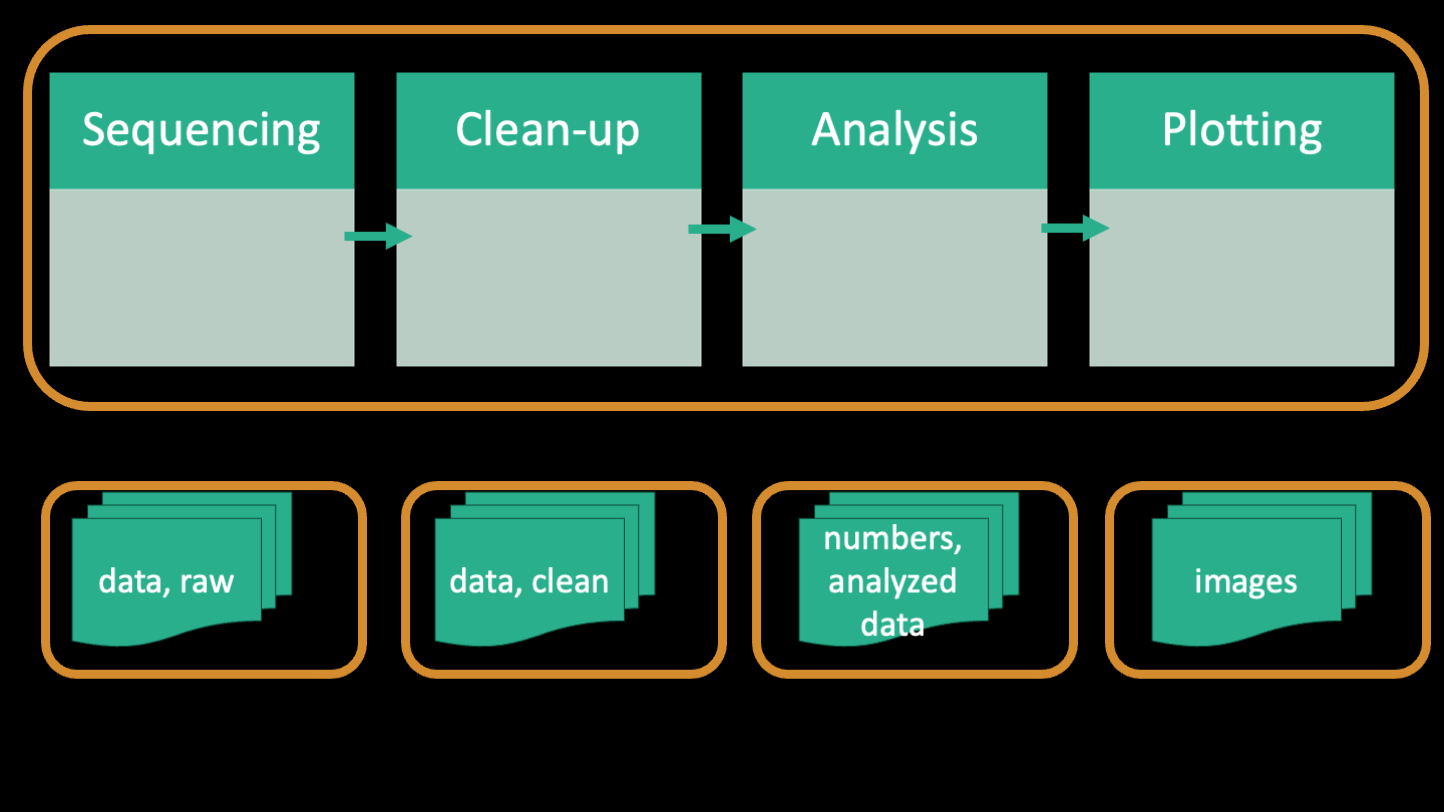
Going back to the workflow from the paper, one can see that bioinformatics is essentially the transformation of raw data to processed data to figures. And that transformation happens using code/scripts.
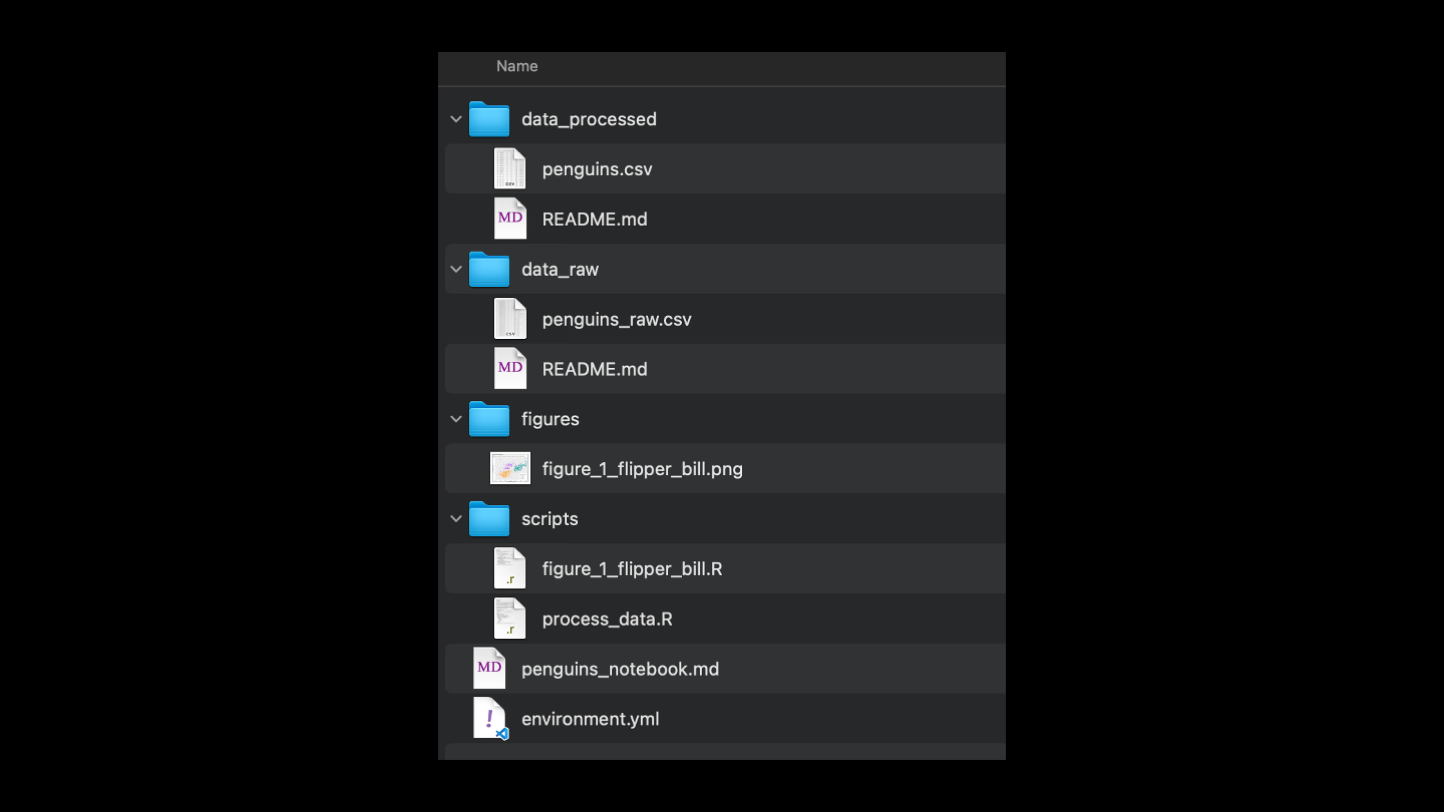
A better system for folder organization is to separate each of these types of files into its own subfolder. In this example, all the raw data is in one folder, never touched. Processed data is in a separate folder. Scripts and figures have their own separate folders too. Additionally, a readme file at each level or at least the top level of the directory can help make this a self-documented folder structure. And finally, it would be helpful to have a file that describes the softwares that are required to run the code, in this case it's a yaml file for a conda environment.
Other tips for good directory organization include: * No more than 1000 files per folder * Shallow folder structure * Consistent naming conventions * No special characters or spaces, EVER
ACTIVITY: Put up example files and have students suggest how it might be reorganized
I've made a folder with a bunch of dummy files. Let's see if we can go through and reorganize it based on what we've learned today. Call out things you see that may be problematic. Feel free to be as pedantic or as critical as you want to be. (This folder activity inspired by the excelent R for Data Science book chapter 6)
Project directories on the Cluster
The next question is where should this project directory itself be located? If it's a small analysis, on your personal computer is probably fine. But we're bioinformaticians and we work with data that often needs specialized software or a lot of computational power, so we often work on a cluster. Hopefully, everyone here has used the cluster at least a little bit and logged on. The FASRC cluster is called Cannon and it's a combination of high performance computing nodes with large storage capacity.
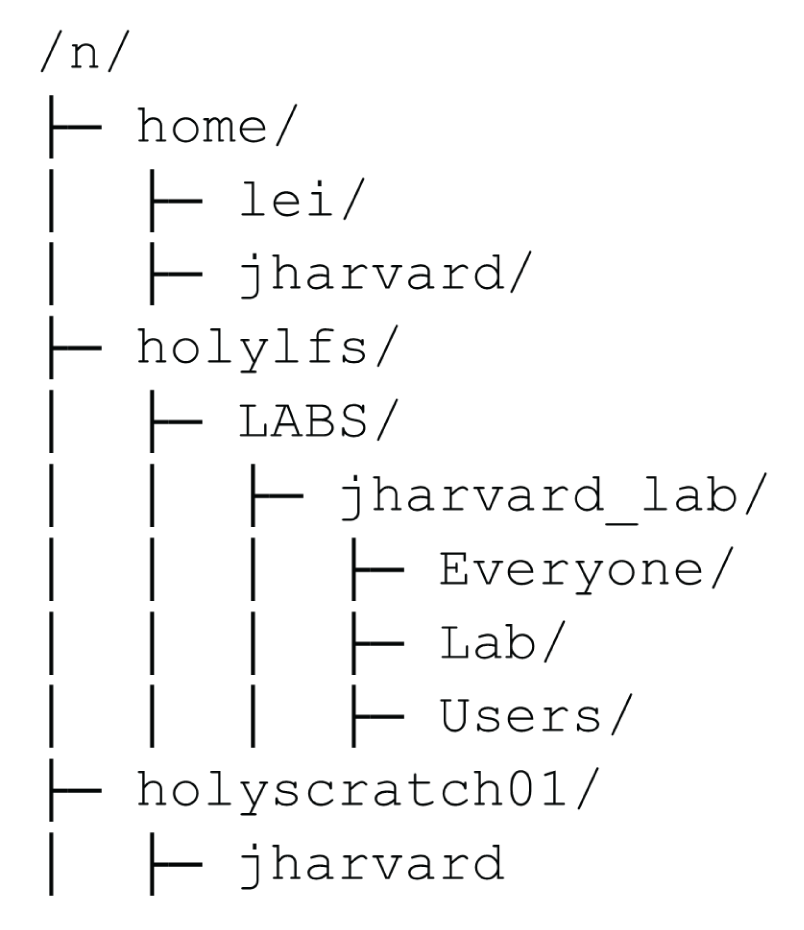
When it comes to storage of files, it's important to understand the storage structure of the cluster. When you log on you are by default landed in your home directory. This is a little patch of storage that is just for you. However, it does not have very much space and it's not networked directly to the place where all the computing happens so while you can do job on your home directory, it might be slow and you might run out of space if you generate a lot of data.
Every one of you also has access to your lab's directory. This LAB directory has a lot of storage space (but not unlimited) and fast connections to the compute nodes, so it's a good place to put your project. Your lab directory has three folders: Users, Lab, and Everyone. These folders are named after who has permission to view or READ the contents as it's known in computer jargon. Everyone who has access to Cannon can view the Everyone folder, only your lab group can view the lab folder, and only you can view your own User folder. Either the Lab or the User folder is a good place to put your project. The Everyone folder is a good place for projects that involve cross-lab collaboration.
There's also the scratch directory, which is a very fast drive in terms of reading and writing files, but files there get deleted if they are >90 days old. It's a good place to run large analyses, but you have to remember to copy the final results over to your lab directory. For this workshop, we'll put everything in the scratch directory since we don't know for sure that your respective lab directories are full. Scratch space is shared by everyone and the limit is very high so you'll always have room there.
ACTIVITY: Have students log on to the cluster and make a new project folder in their scratch directory. Then copy the day 1 files over and organize them
Alright, let's now go to the cluster and make a new project directory in scratch under /n/holyscratch01/lab_name/your_username/healthy-habits. Then we'll copy the data files from the paper from the informatics directory. This is because actually downloading the files from SRA takes a long time. The command we'll use to copy the files over is cp /n/holylfs05/LABS/informatics/Everyone/workshop-data/healthy-habits-2024/day1/* . This should take about 1 minute. Now, you can organize the files yourself in your project directory. The subfolders you should make are data_raw, scripts, and software. Move the files into the appropriate subfolders using mv.
ACTIVITY: Explain the contents of each file
Permissions on the cluster
Every file and folder on the cluster has a set of permissions that determine who can read, write, or execute the file. Execute in this context means run the code that is on that file. You can look at the file permissions by typing ls -l in the terminal. The first column of the output will show you the permissions. The first character is the file type (d for directory, - for file, l for link, etc.) and the next 9 characters are the permissions for the owner, the group, and everyone else. r means read, w means write, and x means execute. By default the files you create can only be edited by you, but you can change the permissions of files you own with the chmod command.
Transferring files
Now that we have our project directory set up, let's go over some ways we can transfer files between local computers and the cluster. The first way is to use a non-command line application to transfer files. For a GUI/app-based solution, there's FileZilla. It's a File Transfer Protocol (FTP) application that can connect to remote servers. You can follow the steps on the RC documentation site to learn how to use FileZilla. link
Another way is to use command line tools to transfer. You can use scp to copy files from the cluster to your local computer and vice versa. You can also use rsync to do the same thing, but it's a little more powerful. rsync can be faster because it only sends data that's been updated while scp sends the whole file every time. There's an rsync and an scp guide on the RC documentation site if you want to learn more.
Let's put that into action and have everyone choose a method they prefer to transfer files. Make the same project directory on your personal computer, add a readme file to it, and then transfer that file from your computer to the cluster in whichever way you prefer. Also transfer everything except the raw data folder and the software folder to your computer. (We'll learn a better way to transfer these files on day 3 with GitHub)
ACTIVITY: Have students make a readme file for the raw data on their personal computer and then sync it to the cluster. Then have them download the files to their personal computer for backup
Making backups, what to save and how?
Our last topic for today is how to make backups and what to save. We kind of touched on this during the data management life cycle part, and now we're going to be more specific. We all know file backups are important, but it's not always clear what needs to be backed up and what doesn't. The general rule is that if you can regenerate the file easily, you don't need to back it up. For example, if you have a script that generates a figure, you don't need to back up the figure, you just need to back up the script. If you have a raw data file that you've processed into a different file, you don't need to back up the processed file, you just need to back up the raw data file and the script. Of course, if it look a really long time to generate the processed file, it might be worth backing up. There's a lot of options for backing things up, depending on file type, what stage the research is in, and the sensitivity of the file.
Let's start with data. One place is a public repository. PlosOne has a handy list of common repositories to report your data. These include Figshare, NCBI, and EBI. Oftentimes, people deposit their sequencing data in these places as a requirement for publication in a journal or due to a grant/funding requirement. But nobody's preventing you from putting your data there as soon as you get it! You can put an embargo on the data as you work on it and then only click the publish button when you're ready to submit. Doing so saves some hassle when you've already got your hands full preparing the manuscript.
More locally, you also have options. If you want the lab to ultimately own your files, your lab may have a network attached storage (NAS) that you can put your files on. This is a big hard drive that's connected to the network and everyone in the lab can access it. You can also use external HDDs to back up your files, just make sure those are stored in a safe place and checked every once in a while to prevent data loss.
Backing up code and other small files is fairly straightforward. One option is to set up rsync between your computer and the cluster to always keep a mirror of your project's "scripts" folder. That way you can write your code on your computer and rsync it to the cluster to run. However, one of the problems with this is that there's not record of past versions of your code. And that can be important if you're experimenting or want to do similar analysis with slight tweaks and you want to go back to a version that worked. This is where git and GitHub come in. We're going to do a full day on learning to use git and GitHub to do version control on day 3, so stay tuned.
Structure of the rest of the workshop
Here's a summary of the topics we'll be covering in the next few days. The next day we'll be having a bonus day where we'll be talking about how to optimize and customize your coding/working environment. These topics will help streamline some frustrating aspects of working with code or on the cluster. Bonus days are more informal and probably won't last the full 3 hours.
Then we'll have 3 straight days of actual workshop content, starting with managing your software environment with conda and singularity, then git and Github, and finally scaling up your scripts to run in parallel on the cluster and how to make code notebooks using jupyter and R Markdown.
Finally, there's one more bonus day focusing on debugging and iterating on your code, including how to work with LLMs to improve your code and how to test your code.
And don't forget we also have office hours every Wednesday from 1:30-4:00 where you can ask your questions. Or you can ask them on our slack channel.
Group discussion and questions
(Alternatively, group discussion if class size is less than 10)
Let's wrap up with a small discussion because I'm curious about where you all are at! Partner up with a couple of people around you and discuss these topics: What are some things this introduction has brought up for you? Are there habits you see you or your peers do that are particularly good or bad? Compare your lab's current policies/practices with another lab's. You have 5 minutes!
5 minutes are up! Anyone want to share?
ACTIVITY: Have students group up in groups of 2-3 and discuss. Each instructor should also sit with a group. Then get back together and chat
Time for questions.